


Support CleanTechnica’s work through a Substack subscription or on Stripe.
The United States North American Council for Freight Efficiency’s (NACFE) Run on Less is underway again, and the lineup is broad. Battery electrics are sharing the road with renewable diesel tractors, natural gas trucks, and a pair of hydrogen fuel cell units. That variety is interesting because it reflects the choices fleets are actually making. It also raises a simple question. If the mission is to showcase real world freight efficiency and lower emissions, why are there so many trucks that do not deliver on either cost or greenhouse gases when you normalize their performance to the same yardsticks? The answer is, hopefully, to present the results with the right metrics, front and center, so the industry can see which paths truly deliver better.

Run on Less is designed to put best practice in the open. Drivers, dispatchers, and technicians show how they operate. NACFE and RMI publish the data. This year’s “messy middle” theme presumably has a purpose. It gathers options that fleets consider to be plausible and puts them on the same field. The risk is that a public dashboard filled with speed traces and charge curves can muddle the story if it does not lead with the outcomes that matter. Cost per mile and well to wheel emissions per mile should open every section. If those two numbers are up front, the rest of the charts become context rather than a distraction.

The two important metrics are simple to define. Cost per mile is the delivered energy cost to move a loaded truck through a given route and climate. Well to wheel emissions per mile are the greenhouse gases from energy production, delivery, and use, normalized to the same 1,000 miles of work. Both need to be grounded in the specific duty cycle and the location where the truck is running. Grid carbon intensity in California is not the same as Arizona. Hydrogen made from natural gas is not the same as hydrogen made with constrained renewables. Methane and hydrogen have near term warming effects that matter for policy and investment. Showing GWP20 beside GWP100 makes that clear without arguing about time horizons.
The methods can be stated in plain language. For battery electrics, use each truck’s kWh per mile from realistic fleet values, apply typical charging losses and local transmission and distribution losses, and multiply by the regional grid carbon intensity. For renewable diesel, use life cycle carbon intensity by feedstock, assume diesel parity on miles per gallon unless the fleet shares better data, and multiply by current retail prices. For natural gas, convert the duty cycle into diesel gallon equivalents, apply upstream methane leakage rates and engine methane slip, and use CNG or LNG retail prices. For hydrogen, start with real retail pumped prices that embed manufacturing, delivery, storage, and dispensing, add consumption near 9 kg per 100 km for current fuel cell tractors, and include process CO2 if the hydrogen is made in a steam methane reformer, upstream methane leakage on the natural gas that feeds the reformer, and hydrogen leakage along the chain. None of this is exotic. It is a clear boundary around how the energy reaches the axle. Because NACFE hasn’t run the numbers, I have.
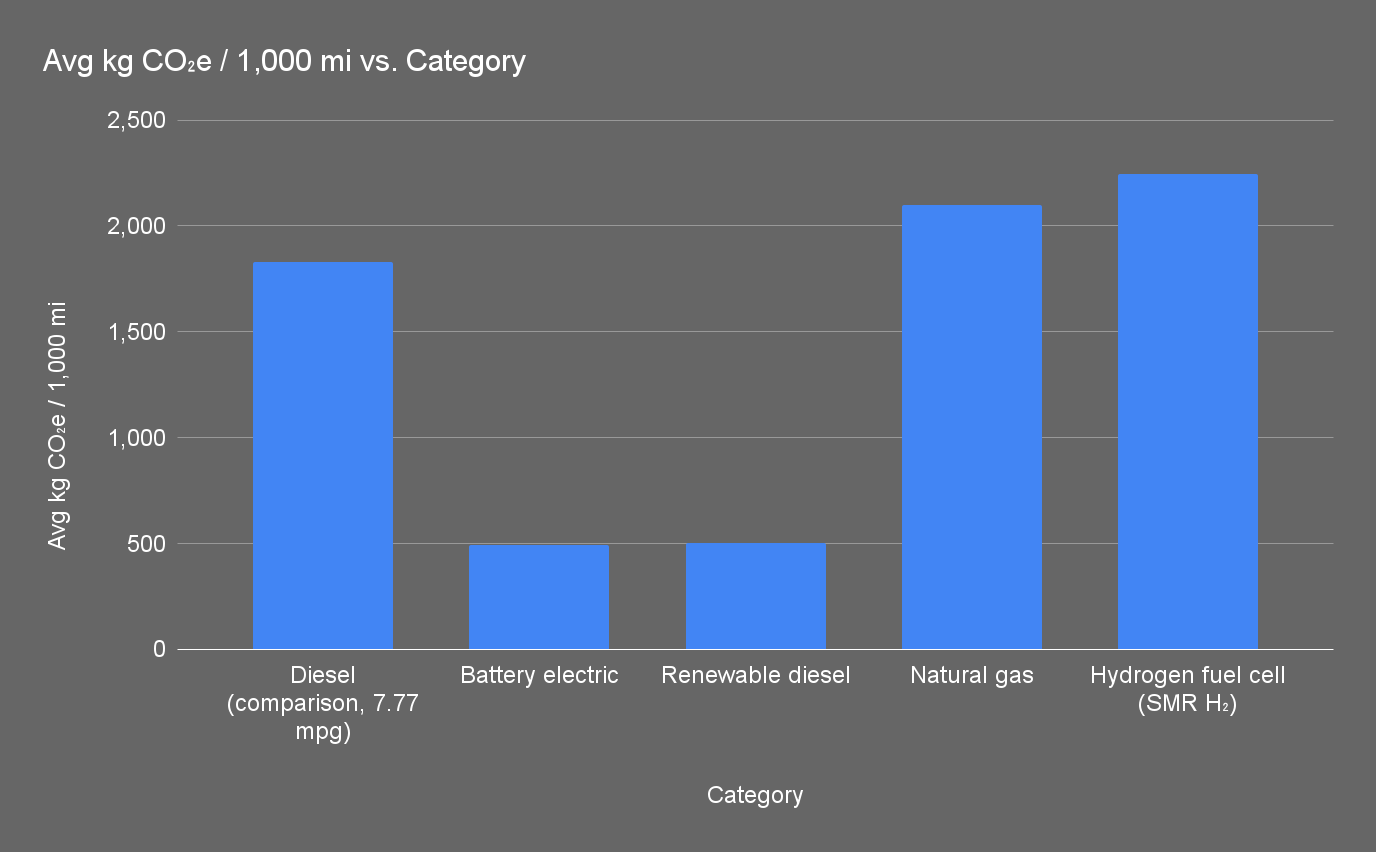
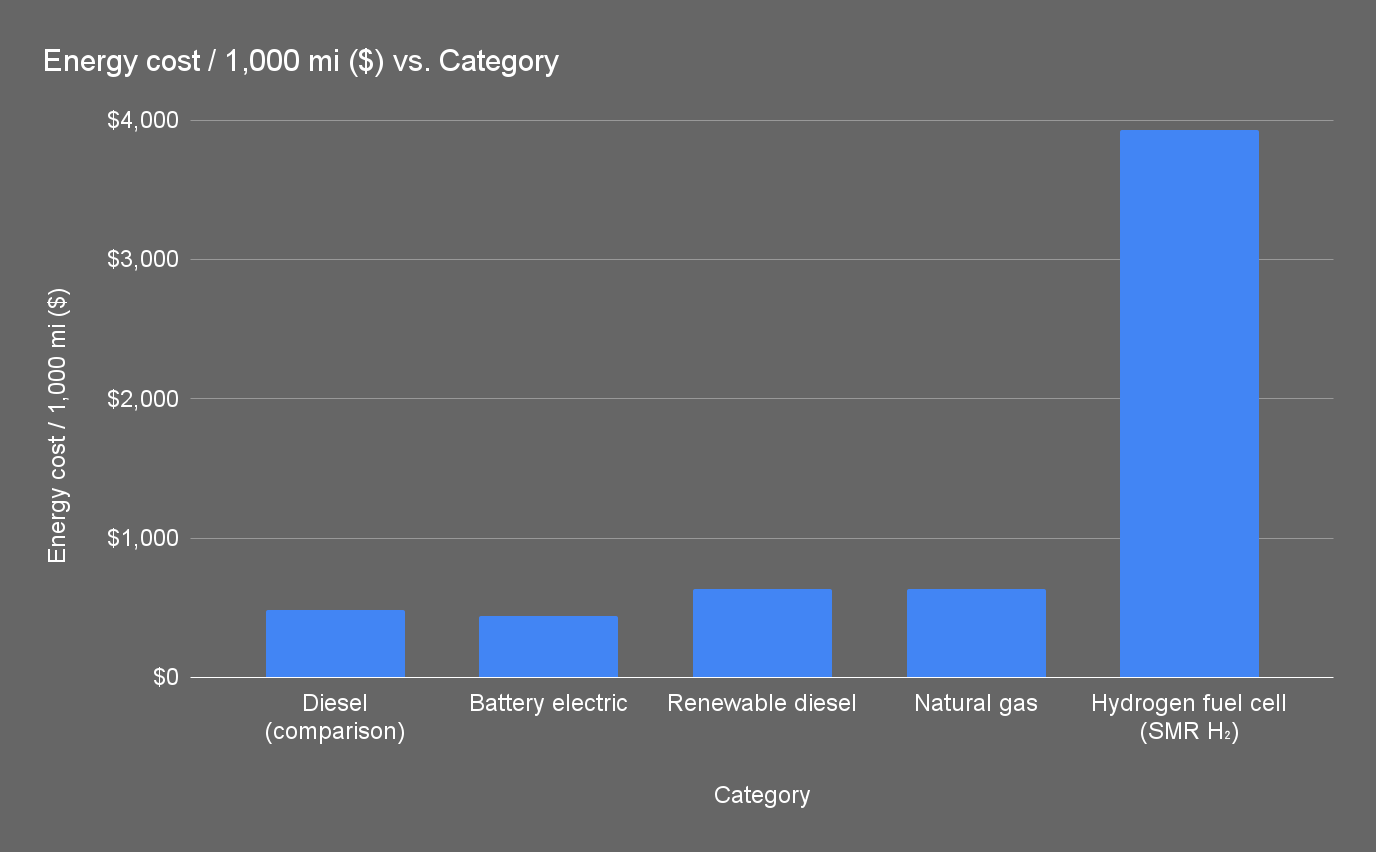
The derived numbers from this Run are already informative. The five battery electric trucks are running in California and Arizona. Using realistic efficiencies and the eGRID 2022 carbon factors for those subregions, the California units land near 406, 406, 430, and 499 kg CO2e per 1,000 miles once you include charging and grid losses, while the Arizona unit on a higher carbon grid comes in near 716 kg. The simple average is about 492 kg per 1,000 miles. The delivered energy cost follows the same pattern. Using current commercial tariffs, those four California trucks sit in the $455 to $558 band for 1,000 miles of work and the Arizona truck is near $250. Averaging across the five gives a rough $440 per 1,000 miles. None of this requires heroics at the depot. It is the product of decent charging windows and the grid that exists today.
Renewable diesel looks acceptable at first glance, which is part of why fleets buy it. On a central life cycle carbon intensity of roughly 30 g CO2e per MJ, a Class 8 tractor at 7.77 mpg lands near 501 kg CO2e per 1,000 miles. The energy cost using recent retail prices is near $633 per 1,000 miles. Nuance matters. If the fuel is made from used cooking oil or tallow, the life cycle number can be lower. If the fuel is made from crop oils like soy or canola, the number moves up toward diesel. Waste based volumes are limited and are already spoken for in many regions. Feedstock disclosure is not a nicety. It changes the outcome by hundreds of kilograms over 1,000 miles.
Natural gas faces a physics problem rather than a marketing problem. Spark ignited engines still slip methane at the tailpipe and upstream supply chains still leak methane during production and processing. On a GWP20 basis that combination dominates the climate math. A reasonable central case for this year’s long haul duty cycles is about 2,099 kg CO2e per 1,000 miles. Pump prices can look competitive, but the climate cost does not move with a cheaper gallon gasoline equivalent (GGE). A CNG tractor at about 6.5 miles per diesel gas equivalent (DGE) will spend near $540 per 1,000 miles on energy at current averages. LNG is closer to $728. Those numbers do not rescue the emissions result. Better engines and lower leak rates would help, but fleets do not control basins, gathering lines, or processing plants. They only see the nozzle.
Hydrogen fuel cells are the most misaligned with the Run’s mission in today’s U.S. conditions when supply is steam methane reforming and retail prices reflect liquefaction and delivery, the most likely sources of hydrogen for the two fuel cell trucks. With current pumped prices near $27 per kg and consumption near 145 kg per 1,000 miles, the energy bill is about $3,926 for the same work that a battery electric does for roughly one tenth of that on many grids. The greenhouse gas outcome is also poor when you include reformer CO2, upstream methane on the natural gas that feeds the reformer, and hydrogen leakage. A central case is near 2,245 kg CO2e per 1,000 miles on a GWP20 basis. These figures do not include the extra energy used for liquefaction or boil off in logistics, so they are not inflated by hidden assumptions. Electrolytic hydrogen made on a clean grid could change the story, but on the grids where freight actually runs today that path is expensive and constrained.
A diesel comparator helps ground the discussion. At 7.77 mpg, which is a level efficient fleets reach on highway duty cycles, diesel lands near 1,830 kg CO2e per 1,000 miles and around $481 in energy cost at national averages. That puts renewable diesel with good feedstocks slightly cleaner than diesel and slightly more expensive, and it leaves battery electric clearly cleaner than both while also cheaper to fuel in the same locations. It also underlines how far natural gas and steam methane reformer hydrogen sit from the mission when you present outcomes rather than inputs.
This is why the NACFE needs bar charts, not a dense scoreboard. The first is well to wheel greenhouse gases per 1,000 miles. Each bar should show the major components. Battery electrics should carry grid generation emissions and charging and grid losses for the specific subregion. Renewable diesel should show a central bar with whiskers that span waste oils on the low end and crop oils on the high end so that readers see the feedstock dependency. Natural gas should split tailpipe CO2 from methane effects and carry two labels for GWP20 and GWP100 so the short lived forcing is explicit. Hydrogen should include reformer CO2, upstream methane, and a separate segment for hydrogen leakage. The assumptions can live in a clear footnote so fleet managers can replicate the math on their own routes.
The second bar chart should present delivered energy cost per 1,000 miles using the same x axis order. Battery electric should use the local commercial tariff and include conversion losses. Renewable diesel and diesel should use recent retail prices with the same mpg. Natural gas should show a CNG bar and an LNG bar so route and station choices are visible. Hydrogen should use a pumped retail price that embeds manufacturing, delivery, storage, and dispensing and show a shaded band for the observed range. A reader should be able to glance left to right and see that battery electric sits lowest on emissions and among the lowest on cost in these locations, renewable diesel is workable but behind, and natural gas and SMR hydrogen are high on both metrics.
Including non BEVs still has value. Real world data on alternatives reveals true operating constraints and ends debates that are based on promise rather than performance. The challenge is communication. Without normalized outcome charts, casual readers can walk away thinking that everything on the road is in the same league. The bar charts prevent that. They respect the audience’s time and show the tradeoffs clearly.
There are a few disclosures that will make the Run stronger. Hydrogen source and price should be explicit. Renewable diesel feedstock should be named. Natural gas methane assumptions should be stated with ranges and citations. Battery electric kWh per mile should be shown beside the grid subregion code so readers can connect the dots. Duty cycle notes should include average speed, payload band, temperature, and elevation change so differences are visible.
When fleets look at this through a procurement lens the picture is practical. Battery electric fits more duty cycles every quarter. It asks for planning on depot power and charging windows, not a leap of faith. Renewable biofuels can be a bridge for legacy assets if feedstocks are waste based and volumes are available, and will, regardless, be pivoting to their end state markets of aviation and shipping. Natural gas remains a climate risk that fleets cannot control. Hydrogen needs very low carbon supply at very low cost and low leakage, plus reliable heavy duty stations, before it can carry its weight on these routes.
The ranking could change as conditions change. Faster grid decarbonization and cheaper commercial power improve battery electric even further. Waste oil supply is limited and will not scale to decarbonize heavy freight on its own. Verified single digit methane leakage and better engines would help natural gas but do not erase the gap on near term warming. Hydrogen would need a combination of cheap clean generation, high electrolyzer capacity factors, minimal leakage, and a dense network of stations to compete, and those elements are not in place in the operating regions featured this year.
Run on Less succeeds when it makes the efficient path obvious. Putting cost per mile and well to wheel emissions per mile at the top of the dashboard aligns the event with its mission. The data from this year shows a simple pattern. Renewable diesel can help in the short term, but battery electric is already pulling away on both cost and carbon where these trucks are running. If the Run keeps those two numbers front and center, fleets, shippers, and regulators will have what they need to move faster.
Sign up for CleanTechnica’s Weekly Substack for Zach and Scott’s in-depth analyses and high level summaries, sign up for our daily newsletter, and follow us on Google News!
Have a tip for CleanTechnica? Want to advertise? Want to suggest a guest for our CleanTech Talk podcast? Contact us here.
Sign up for our daily newsletter for 15 new cleantech stories a day. Or sign up for our weekly one on top stories of the week if daily is too frequent.
CleanTechnica uses affiliate links. See our policy here.
CleanTechnica’s Comment Policy
cleantechnica.com
#NonBEV #Trucks #NACFEs #Run


